Monitoring the balance of tree and grass cover
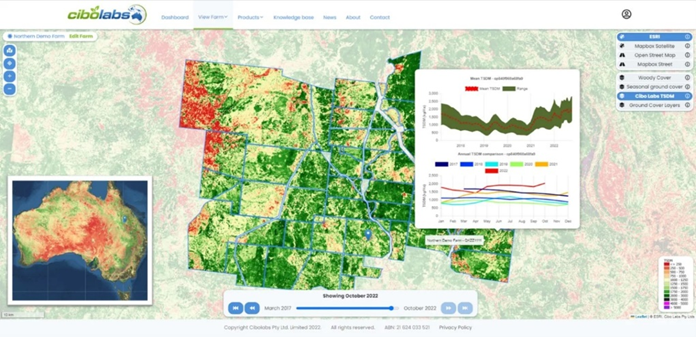
Caption: Australian Feedbase Monitor
Environmental stewardship is one of the four key themes of the Australian Beef Sustainability Framework (ABSF). The theme consists of seven priorities, one of which is the Balance of Tree and Grass Cover.
The Balance of Tree and Grass Cover refers to the change in vegetation associated with beef or feed production, including losses and gains in forests, woodlands and grasslands. The ABSF bases its indicator results on satellite imagery collected and mapped by CIBO Labs.
Monitoring vegetation and ground cover
Phil Tickle is the Managing Director and Co-Founder of CIBO Labs, which was established in 2018 to support individual cattle producers and the broader livestock industry through digital data and data science. The company provides pasture monitoring services to approximately 50 million hectares of farmland across Australia every week.
“One of the initiatives we have been involved in is the ABSF. Specifically, we help monitor vegetation and ground cover,” Phil said.
“For the ABSF, our team analyses changes in ground cover across the country at a resolution of less than a hectare on a seasonal basis. We then also identify the extent to of individual NRM (Natural Resource Management) regions are achieving their ground cover targets.”
To capture images and data for ground cover, CIBO Labs work collaborates with the Joint Remote Sensing Research Program, a nationally coordinated initiative led by the Queensland Government. They also work with the Terrestrial Ecosystem Research Network to obtain further imagery.
“We’re taking the existing data and analysing it according to the ABSF indicators.”
Another key area of analysis is the balance of tree and grass cover, which tracks woody vegetation trends across the country.
“Through the Australian Government there is a data set published, which was largely driven by greenhouse accounting requirements. It’s also able to provide since 2000, annual changes in both the extent of sparse vegetation, usually called woodland or dense woody vegetation.” Phil explained.
Phil and his team use this data to assess annual changes in forests and woodlands.
“We also identify what vegetation is changing, whether it is primary or secondary forest.
“The main thing we are trying to communicate to people is the dynamics of vegetation management, just because you're clearing pasture doesn’t mean you’re clearing primary forest.”
Phil highlighted that in many cases, land clearing involves removing regrowth as part of vegetation management to maintain healthy grazing systems and ecosystems.
Forest versus woodland
Mapping tools allow researchers to differentiate between forests and woodlands by analysing canopy cover percentages.
|
Current Australian Definitions
|
Seasonal conditions can significantly influence the transition between woodland and forest or vice versa.
“Being able to have the mapping images is crucial – not only for understanding what is changing but also for assessing the impact of seasonal conditions,” Phil said.
Where and how can you view the maps?
For the Australian Beef Sustainability Framework, the Australian Feedbase Monitor (AFM) provides a simple, user-friendly public viewing platform.
“If they’re an individual producer and meet requirements, they access the AFM for free through the myMLA dashboard free of charge,” Phil explained.
“Essentially from there, producers can set up their farm in the map and zoom in to view it.”
To specifically view woody cover, users can select the “Woody cover” button in the top right-hand corner. This feature displays the latest satellite image and allows comparisons with data from the past 30 years.
The map is colour-coded to differentiate between various woodland and forest categories.
What does it mean for the future?
Forests are not found everywhere in Australia, but in regions where they exist, long-term monitoring is crucial.
“Monitoring these changes helps provide early indicators of habitat loss or gain,” Phil said.
By tracking trends in woody vegetation and forest coverage, CIBO Labs can generate lead indicators for habitat quality, potential habitat decline and broader environmental impacts.
“In terms of sustainability, the more data we have there, the better. It helps us to understand better what we are dealing with and then develop the strategies and technology to implement new and improved practices.”